

The 1950 census is a gold mine of information for genealogists and historians. The data collected provides a snapshot of American life in the mid-20th century. Here are some interesting facts and statistics from the 1950 census.
Key Stats
- The total population in the 1950 census was 150,697,361. More than 26 million of them are still living today.
- 10.7% of the population was under the age of five (hello baby boomers).
- Over 32 million people were “keeping house.” 99.1% were women.
- The most populated cities in the 1950 census were New York (7,891,957), Chicago (3,620,962), Philadelphia (2,071,605), Los Angeles (1,970,358), and Detroit (1,849,568). New York City had more people than the next three cities combined.
- The 1950 census will be released to the public on Apr 1, 2022—72 years after it was taken.
Population Statistics
This section will explore some of the most interesting population stats from the 1950 census.

The total population in the 1950 census was 150,697,361. This was an increase of 14.45% (over 19 million people) from the 1940 census.
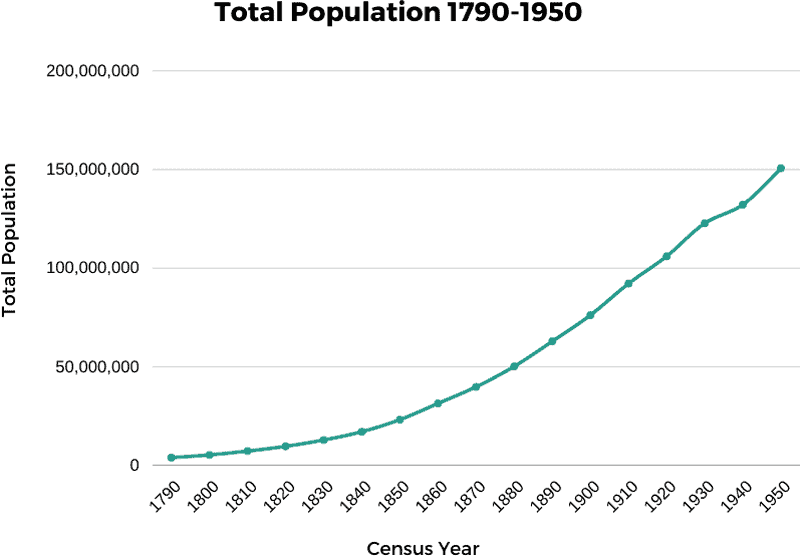
| Census Year | Total Population |
|---|---|
| 1790 | 3,929,326 |
| 1800 | 5,308,483 |
| 1810 | 7,239,881 |
| 1820 | 9,638,453 |
| 1830 | 12,866,020 |
| 1840 | 17,069,453 |
| 1850 | 23,191,876 |
| 1860 | 31,443,321 |
| 1870 | 39,818,449 |
| 1880 | 50,189,209 |
| 1890 | 62,947,714 |
| 1900 | 76,212,168 |
| 1910 | 92,228,496 |
| 1920 | 106,021,537 |
| 1930 | 122,775,046 |
| 1940 | 132,164,569 |
| 1950 | 150,697,361 |
Most Populated States
The most populated states in the 1950 census were New York, California, Pennsylvania, Illinois, and Ohio.
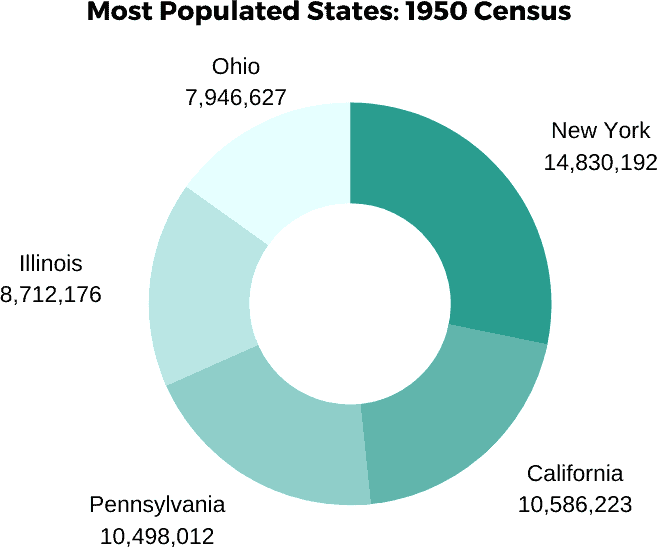
| State | Total Population |
|---|---|
| New York | 14,830,192 |
| California | 10,586,223 |
| Pennsylvania | 10,498,012 |
| Illinois | 8,712,176 |
| Ohio | 7,946,627 |
States with the Highest Percent Increase from 1940
The states that saw the highest percentage increase from the 1940 census were California, Arizona, Florida, Nevada, and Oregon.
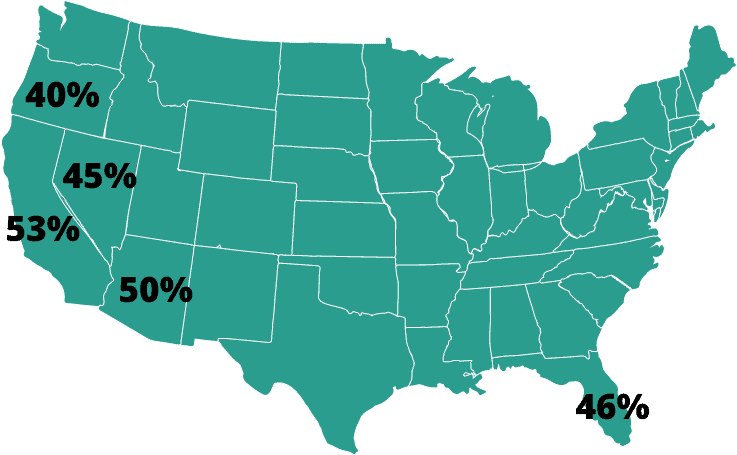
| State | Percentage Increase |
|---|---|
| California | 53% |
| Arizona | 50% |
| Florida | 46% |
| Nevada | 45% |
| Oregon | 40% |
Most Populated Cities
The most populated cities in the 1950 census were New York, Chicago, Philadelphia, Los Angeles, and Detroit.
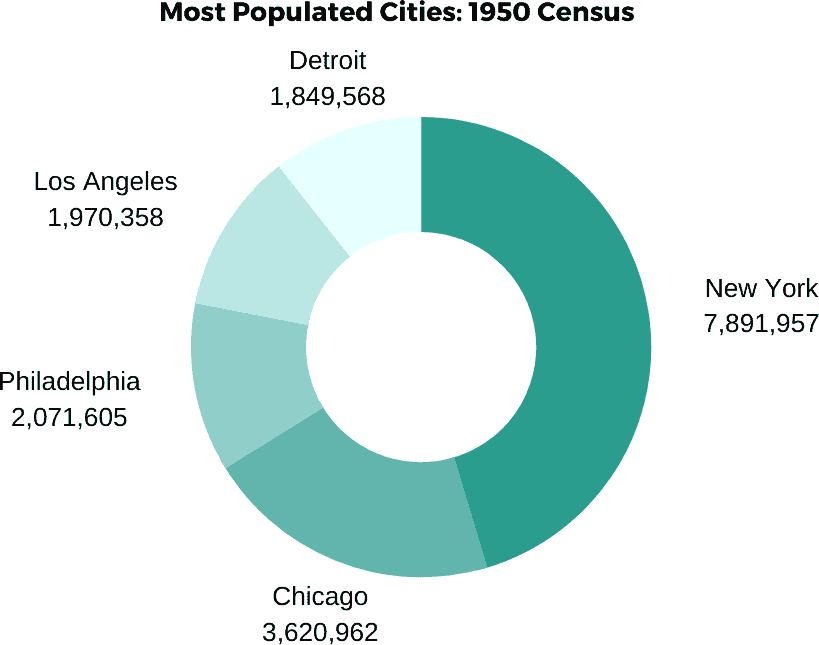
| City | Total Population |
|---|---|
| New York | 7,891,957 |
| Chicago | 3,620,962 |
| Philadelphia | 2,071,605 |
| Los Angeles | 1,970,358 |
| Detroit | 1,849,568 |
In New York City, Brooklyn was the most populated borough followed by Manhattan, Queens, Bronx, and Richmond.
Moving back 100 years, the most populated cities in the 1850 census were New York, Baltimore, Boston, Philadelphia, and New Orleans.
Urban versus Rural Populations
- 64% of Americans lived in urban areas whereas 36% lived in rural areas. Nearly 50% of the Urban population lived in Central Cities with populations over 50,000.
- Compared to 1940, the urban population increased 19.5% while the rural increased by 7.9%.
- The numerical increase of the rural population was the largest since the period of 1890-1900.
- There were five cities of 1 million+ in 1950. 101 cities existed with populations of 100k-1 mil.
Taking the Census
This section takes a closer look at how the 1950 census was enumerated, highlighting some of the more interesting stats.
Date of Enumeration
The date of enumeration began on April 1, 1950, and was completed by the end of June. The overwhelming majority (66%) was completed by mid-April.
Other Interesting Enumeration Statistics
- People serving in the military were enumerated as residents of the location where their military installation was located. Their families were enumerated in their actual place of residence.
- Crews of American vessels out at sea were counted as living abroad. In 1940, they were marked as living in the Port was the vessel operated from.
- College students living away from home were considered residents of the place they went to school. In 1940, they were marked as temporarily absent from their family homes.
- The areas enumerated were: the continental United States, the Territories of Alaska and Hawaii, American Samoa, the Canal Zone, Guam, Puerto Rico, and the Virgin Islands of the United States. Some of the smaller islands and island groups were also included.
Characteristics of the Population
Race
The Census Bureau instructed it’s enumerators to record race as follows:
- “W” for White
- “Neg” for Negro
- “Ind” for American Indian
- “Chi” for Chinese
- “Jap” for Japanese
- “Fil” for Filipino
- For all others, they wrote the race in full
The overwhelming majority of the population (89.6%) was considered white.
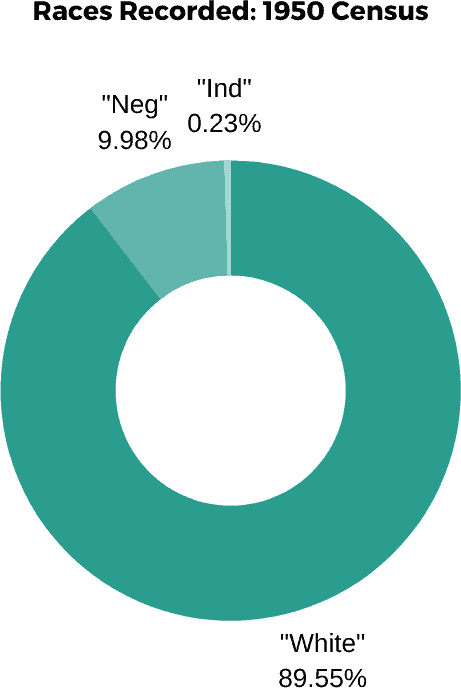
| Race Recorded | Percentage of Population |
|---|---|
| “White” | 89.55% |
| “Neg” | 9.98% |
| “Ind” | 0.23% |
| “Jap” | 0.09% |
| “Chi” | 0.08% |
| Other | 0.07% |
A few things to keep in mind about this statistic:
- People of Mexican origin were considered white unless they were “…definitely of Indian or other nonwhite race.”
- Both African Americans and Native Americans of mixed race were not counted as “white.”
Age & Gender
The largest age group by percentage was 0-19 years (34%).
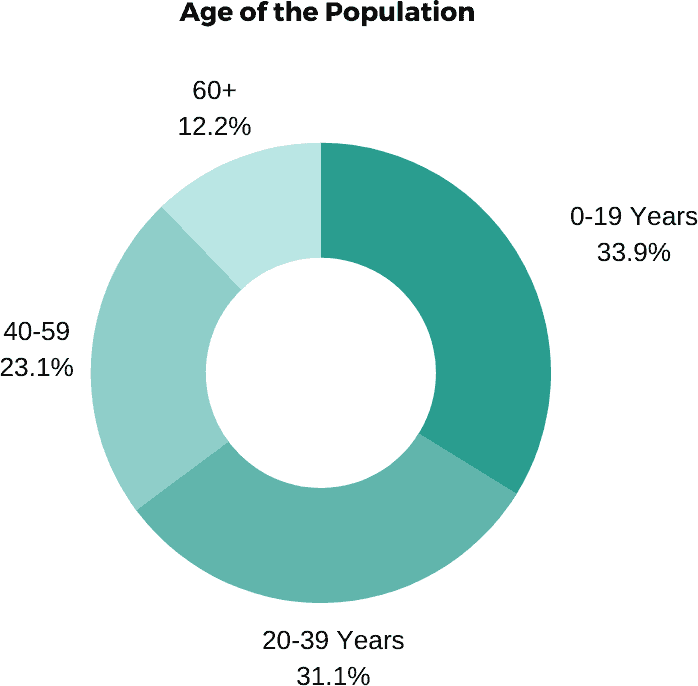
- 49.76% of the total population was male. 50.24% was female.
- 10.7% of the population was under five years old. 0.4% were 85+ years.
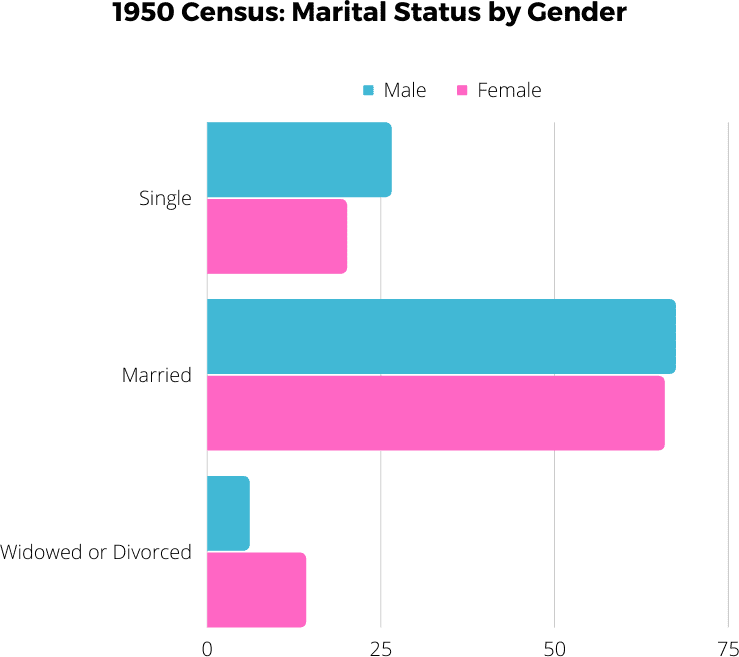
Marital Status
Of the population 14 years and older, 67% of males and 66% of females were married. Interestingly, only 6% of males were widowed/divorced compared to 14% of females—more than double.
Citizenship
Of the population of 21 years or older, nearly 90% were native citizens. 7.7% were foreign-born and naturalized. Only 1.9% were foreign-born and not naturalized.
You were considered naturalized if you had taken out final papers, or if either of your parents had done so. People in the process of naturalization were not counted as being naturalized.
Unlike previous censuses (1920 and before), foreign-born women were not extended the naturalization status given to their husbands. They were required to apply themselves.
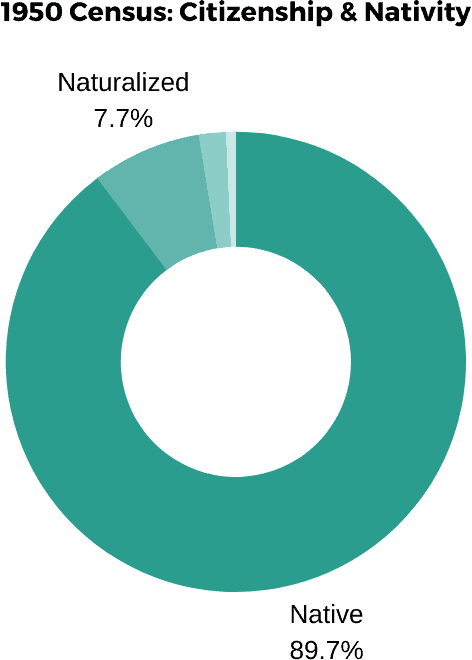
| Citizenship | Percentage of Population 21+ Years |
|---|---|
| Native | 89.7% |
| Naturalized | 7.7% |
| Alien | 1.9% |
| Not Reported | 0.7% |
Country of Birth of Foreign-Born
The countries of birth were based on the international boundaries at the time of the census. Here are the top 10 countries of the foreign-born white population.
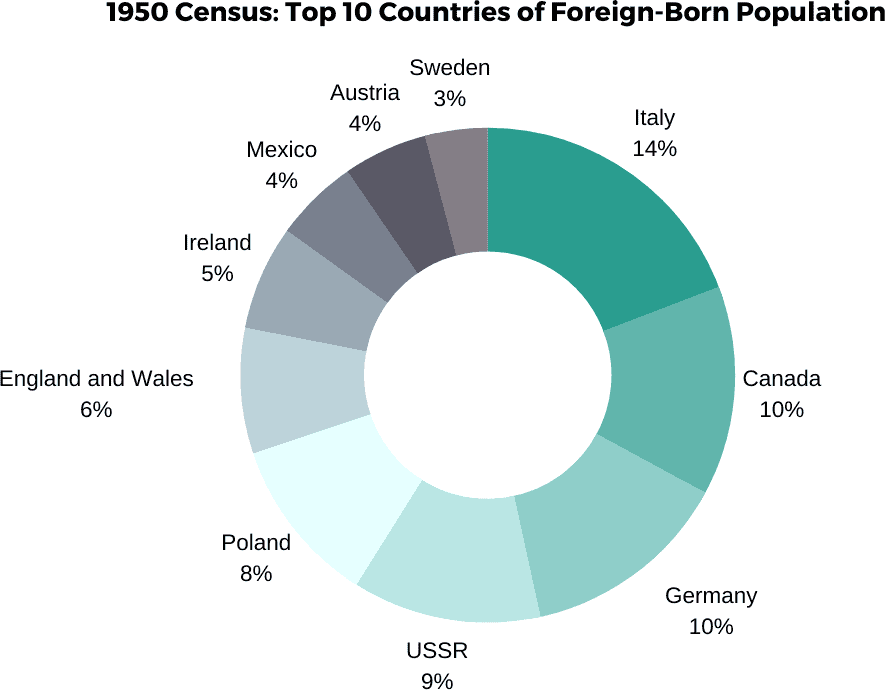
| Country | Foreign-Born White Population |
|---|---|
| Italy | 1,427,145 |
| Canada | 994,562 |
| Germany | 984,331 |
| U.S.S.R | 894,844 |
| Poland | 861,184 |
| England and Wales | 584,615 |
| Ireland | 504,961 |
| Mexico | 450,562 |
| Austria | 408,785 |
| Sweden | 324,944 |
Employment Status
Of the total population 14 years and older:
- 53% were considered to be in the labor force.
- 73% of the labor force were men.
- Over 32 million people were “keeping house.” 99.1% were women. Keeping house included housework, and taking care of children. This did not include paid housework for someone else.
- 4.8% of the civilian labor force was unemployed. Ten years earlier in 1940, that number was 14.5%.
- 25.9% of employed persons worked in the manufacturing industry.
- 28% of families made less than $2,000/year.
- The median family income was $3,073/year.
Area and Density
- 3,628,130 sq. miles of land and water were under the jurisdiction of the United States in 1950. In 1790, that number was 892,135 sq. miles—less than 25%.
- The population per square mile in 1950 was 50.7 (in the continental U.S.)
