Explaining what low confidence regions are is entirely confusing but if you stick with me, I hope I can help you turn a headache into…less of a headache at the least.
So what is a low confidence or trace region on Ancestry DNA?
A low confidence trace region is one where Ancestry is not able to confidently predict because you don’t have enough of that region’s DNA. It’s a region where your estimated ethnicity is 5% or below and the estimated range is between 0-15%.
The key is that the range must include 0%. So if your report says 5% Irish with a range 0-10%, that would be a low confidence trace region.
But if it said 5% with a range of 1-10%, that would not be a low confidence trace region because the range doesn’t include 0%.
The idea is that if the range includes 0% then it’s possible you’re not from there at all. But if includes 1%, then they’re confident you come from there, but they’re just not sure how much of your ethnicity comes from that region.
When an individual consumer purchases a DNA kit, they are oftentimes perplexed at the amount of terminology used in their results.
Most times, this lingo can be off-putting and other times, people just turn away and assume that the results they are given are indeed factual evidence that they are, for example, 33% Irish. Peeling back the scientific jargon exponentially changes the way these results are viewed.
The most important note to make before diving into the science behind the ethnicity estimates and ethnic breakdowns, is the fact that the AncestryDNA results are constantly being updated.
They are not fixed. As science improves these percentages become more and more accurate. As more populations are tested, the results produce more accurate findings as well and minimizes the chances of your DNA results being wrong.
A vast group of consumers who purchase DNA kits provide a sample, review their data once and never log in again. They fail to realize that, even though they paid for their test, it is still constantly being updated for the latest and most up-to-date results.
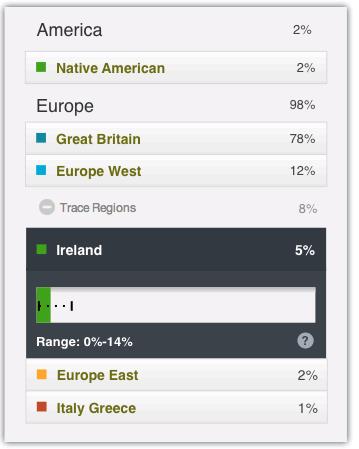
With that said, when someone is viewing their results, there are more than just percentages with country names slapped down beside them. There is much more that goes into it. Attached below is a photo example from Ancestry’s site explaining the very same thing.

We will call this individual, Sally. Sally is confused as to why under “trace regions” she is listed as 5% Irish and why, beneath that there is a green chart with even more percentages.
As confusing as it can be, this chart is displaying a Low Confidence Region. All Low Confidence regions range from 0% – 15% and this shows that she can have DNA from Ireland and also, she might not have any DNA from there at all.
I always remember that Trace Regions can come from just the smallest trace of noise which can be a fluke and it could, potentially, be slightly accurate.
As the continuation goes on in working on the accuracy of these ethnicity statementsand ethnic breakdowns it is important to note that, as more data comes in and updates are sent out to consumer’s tests that these trace regions may graduate to actual percentage or they may fall off and disappear altogether.
As you can see, Sally has about 8% of her DNA listed under Trace regions. Perhaps 5% is from Ireland and the other few may fall somewhere else. Ancestry, not being certain, does not want to make any mistakes or assumptions thus, they give us these regions. Low confidence regions only are provided to state that you may or may not share any DNA with a particular ethnic group or regions.
Outside of these trace regions there are also “other regions tested” which allow you to see what other ethnic groups your DNA was run against and these likely come back with 0% meaning you have no trace of DNA from those other ethnic groups and places.
When you are viewing your ethnicity statements or ethnic breakdowns and you see the list of countries, it is important to realize that those countries only have been around for a sliver of time in the larger scheme of life.
Thus, you can understand that working on accuracy from Great Britain and Ireland is definitely a massive undertaking. Afterall, these two countries are comparable to the States of Washington and Oregon. Genetically, how do we differentiate someone who is Oregonian vs Washingtonian?
Now, Great Britain and Ireland have been separated by water for quite a while but you can definitely imagine that there can be some crossover or noise that will come through the data at some point.
Rather than Ancestry saying, “Yep, you’re this and this” they are showing the consumer that there is room for adjustment and that this adjustment is something that is bound to come with time when science improves their accuracy.
DNA was first identified in the 1860’s by Swiss Biologist Friedrich Miescher. It took nearly 9 decades before James Watson and Francis Crick discovered the double helix.
Long before James and Francis made their big discovery which, historically, knocked Friedrich out of the spotlight, Friedrich had isolated the 5 nucleotide Bases Adenine, Guanine, Cytosine, Thymine and Uracil (ATCGU) for which he won the Nobel prize in 1910. So DNA, in the sense of being known about, has been around for nearly 160 years. Scientifically, it has only been being widely studied for about 70 years.
Imagine with 70 years of really learning and wrapping our brains around the science of it all, we can now get our own DNA tests done to view this ethnic data. It is truly incredible how science evolves at such lightning speed and that only goes to show that within the next few decades, it can only improve and grow more accurate.
I always encourage genealogists or adoptees looking for their biological family to approach their ethnicity estimates and ethnic breakdowns with caution. Afterall, they are merely estimates.
This goes for the other testing sites like 23andMe, MyHeritage, FtDNA, and even the other ethnicity tools on websites like GEDmatch (see best Gedmatch admixture calculators). Each of these websites utilizes different approaches to their consumer’s ethnicity estimates and ethnic breakdowns so, for fun, if you really wanted to see some numbers and percentages change you can upload your AncestryDNA to the other sites.
The major point I take away from Ancestry when they are very open and honest with their trace regions is their transparency. Very few data and tech companies are transparent with their customers. Ancestry recognizes the temporality of it’s consumer’s ethnicity statement and ethnic breakdown results and they want the consumers to know that eventually the updates will come.
They don’t want to come out right away and say “You’re X,Y and Z” and when things change, look bad when their data is way off. They understand that their sciences are going to constantly grow more advanced and I really hope that using these trace regions in the way they have been, allows us consumers to respect their efforts and their open-ness to say “Oh, nevermind. We were wrong but we had an idea”.
Thus, a grain of salt one must be taken with DNA results when it comes to ethnic breakdowns or ethnicity statements and that goes for any DNA company you test with. Low Confidence Regions reflect that you are less likely to belong to that ethnic group or region.
Higher confidence regions mean that you are more likely to belong to that ethnic group or region. Low confidence regions may be residual sound overlapping from other data and the individual may not have any trace of DNA coming from that ethnic population or region.
Sometimes noise can be residual and sometimes it can really be telling. Either way, patience for the future of DNA technology is something that we should all be very excited about. I always say, 10 human years might as well be 50 years for the DNA world.
Sooner than later, we will be able to trace more precise migration patterns and hopefully, we will all be able to pinpoint much more precise ethnicity statements and ethnic breakdowns.


